Hi, I'm Tashfeen Ahmed
Sr. Product Designer at Microsoft
Selected Work

The new era of creativity with Microsoft Word
During a pivotal platform shift driven by AI, I was among the first designers to integrate the transformer-based (GPT) language models into Microsoft's ecosystem (mainly Word), used by over a billion people worldwide. My work on Copilot in Word helps users draft, summarize, rewrite, and even chat about documents, unlocking productivity and creativity. By designing new patterns and interactions, I redefined how people create and edit content, offering tailored suggestions and proactive text transformations—all within the familiar Word environment.
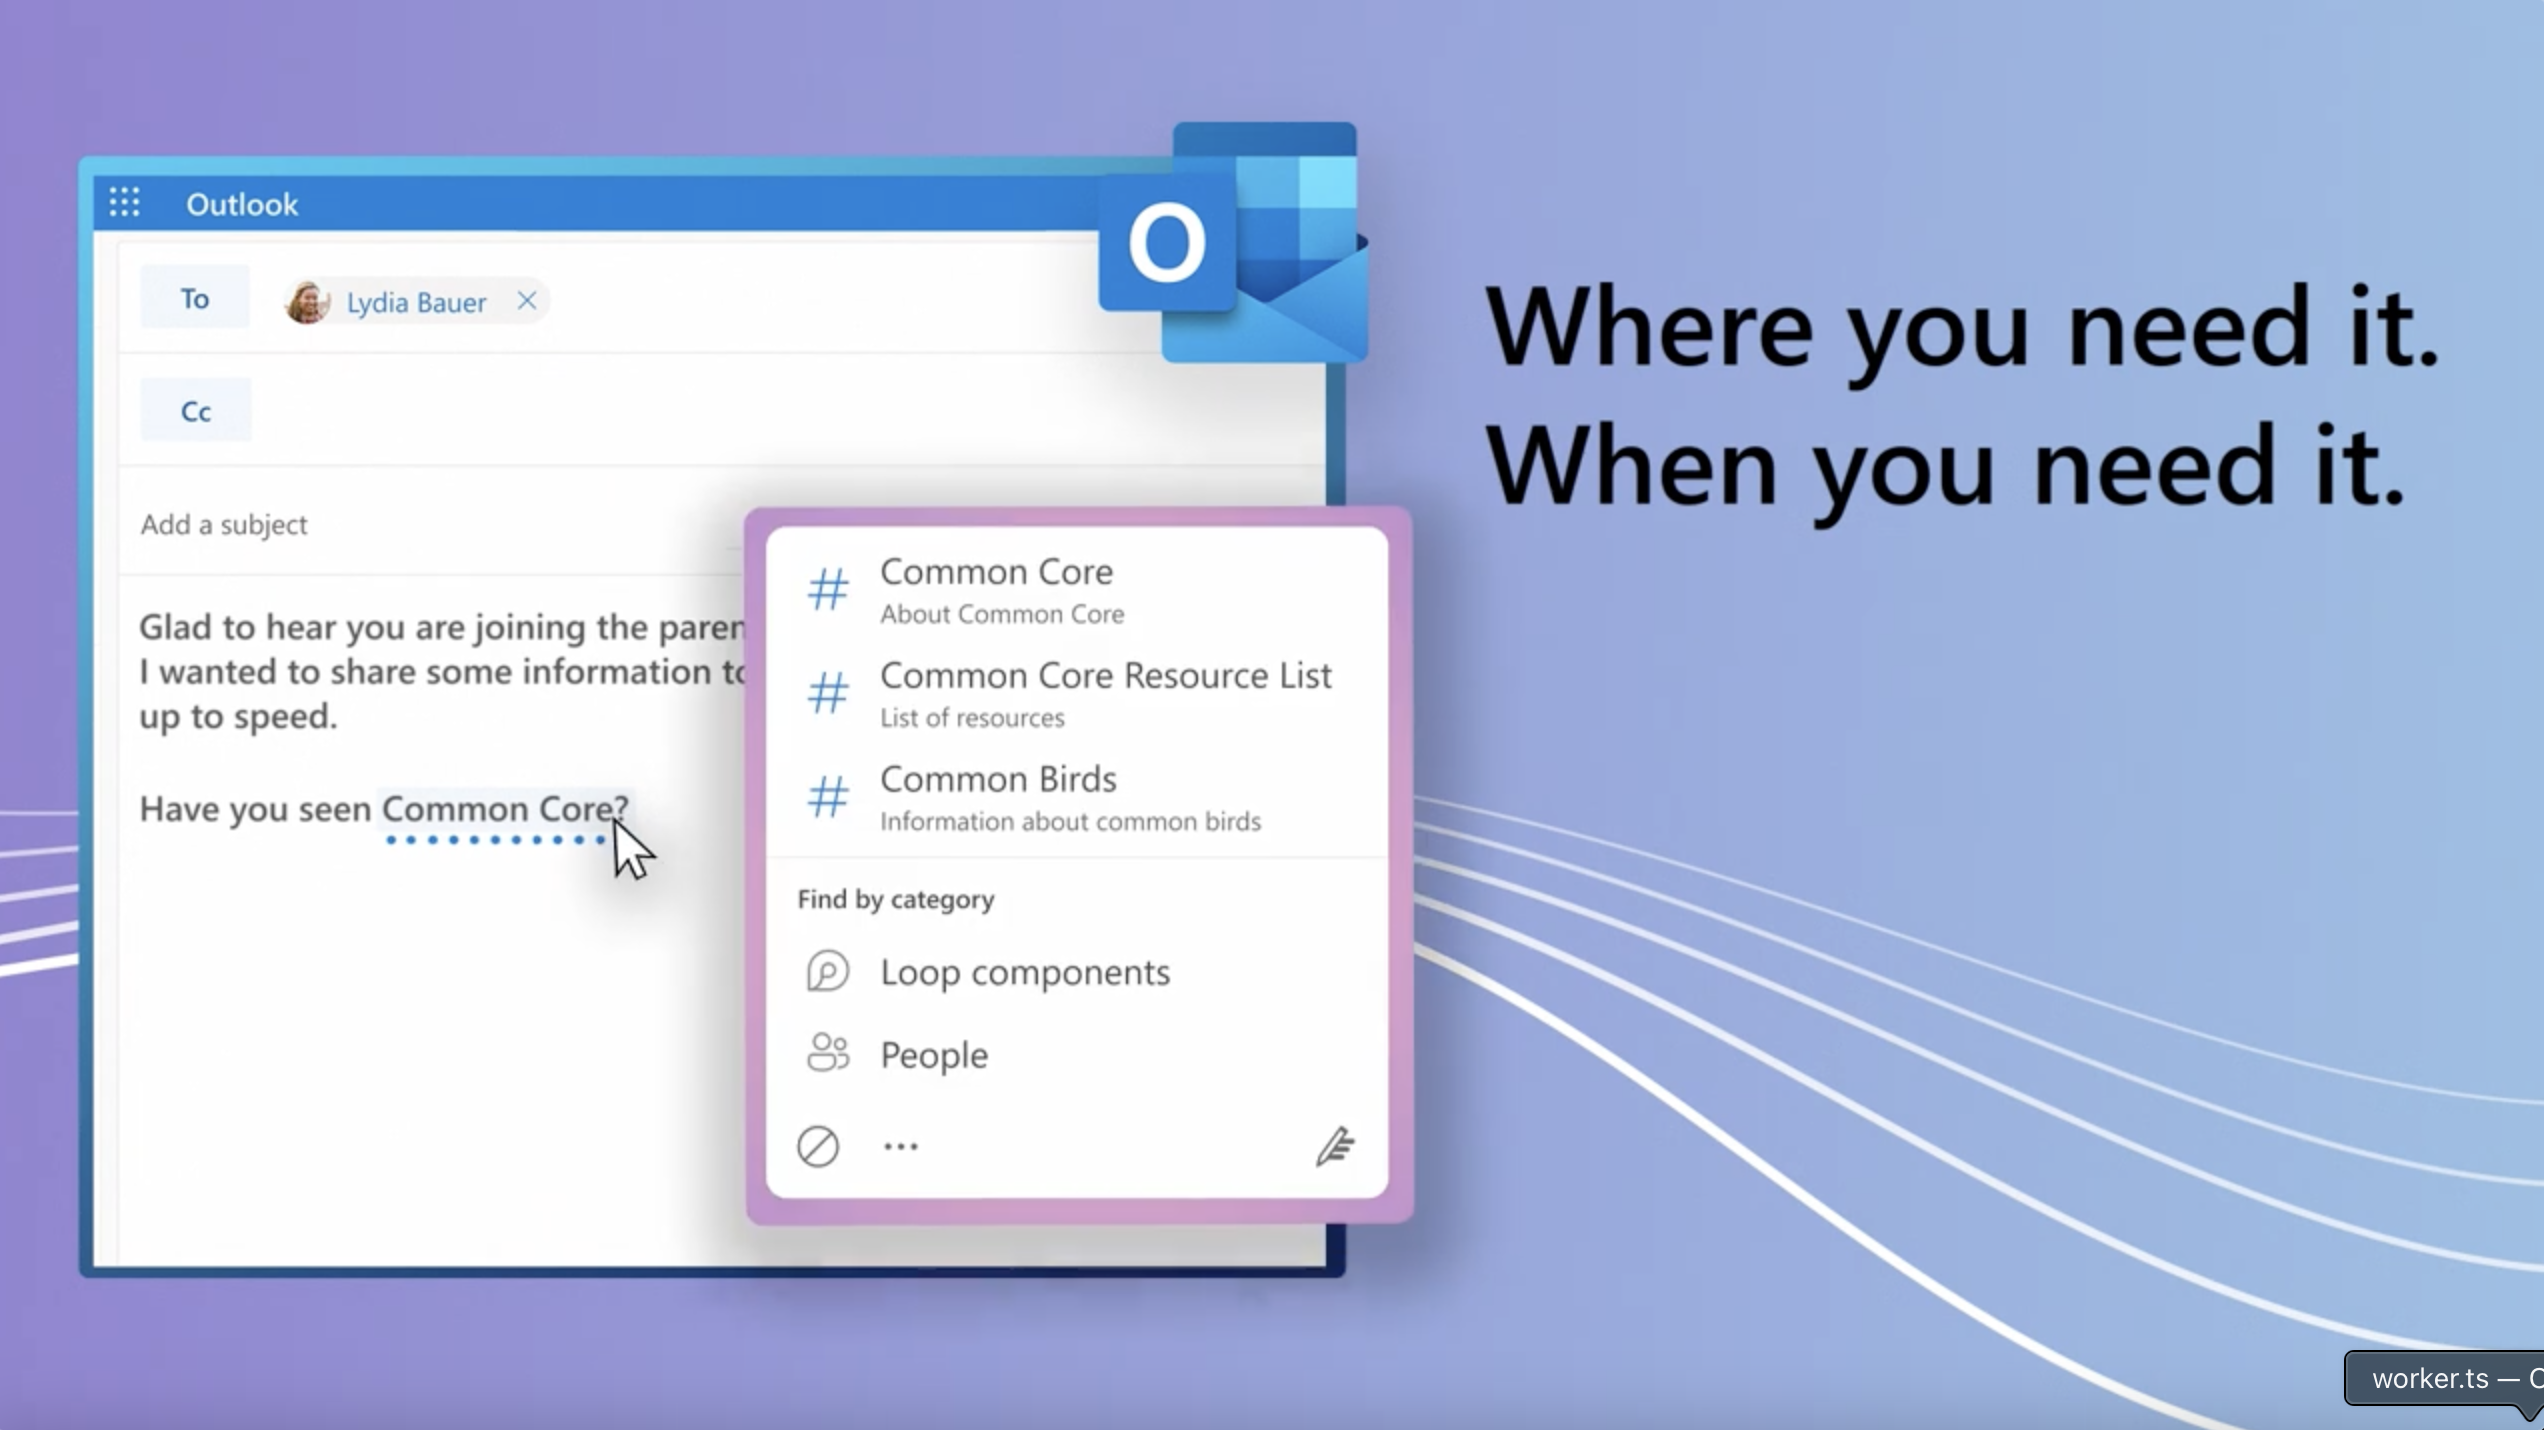
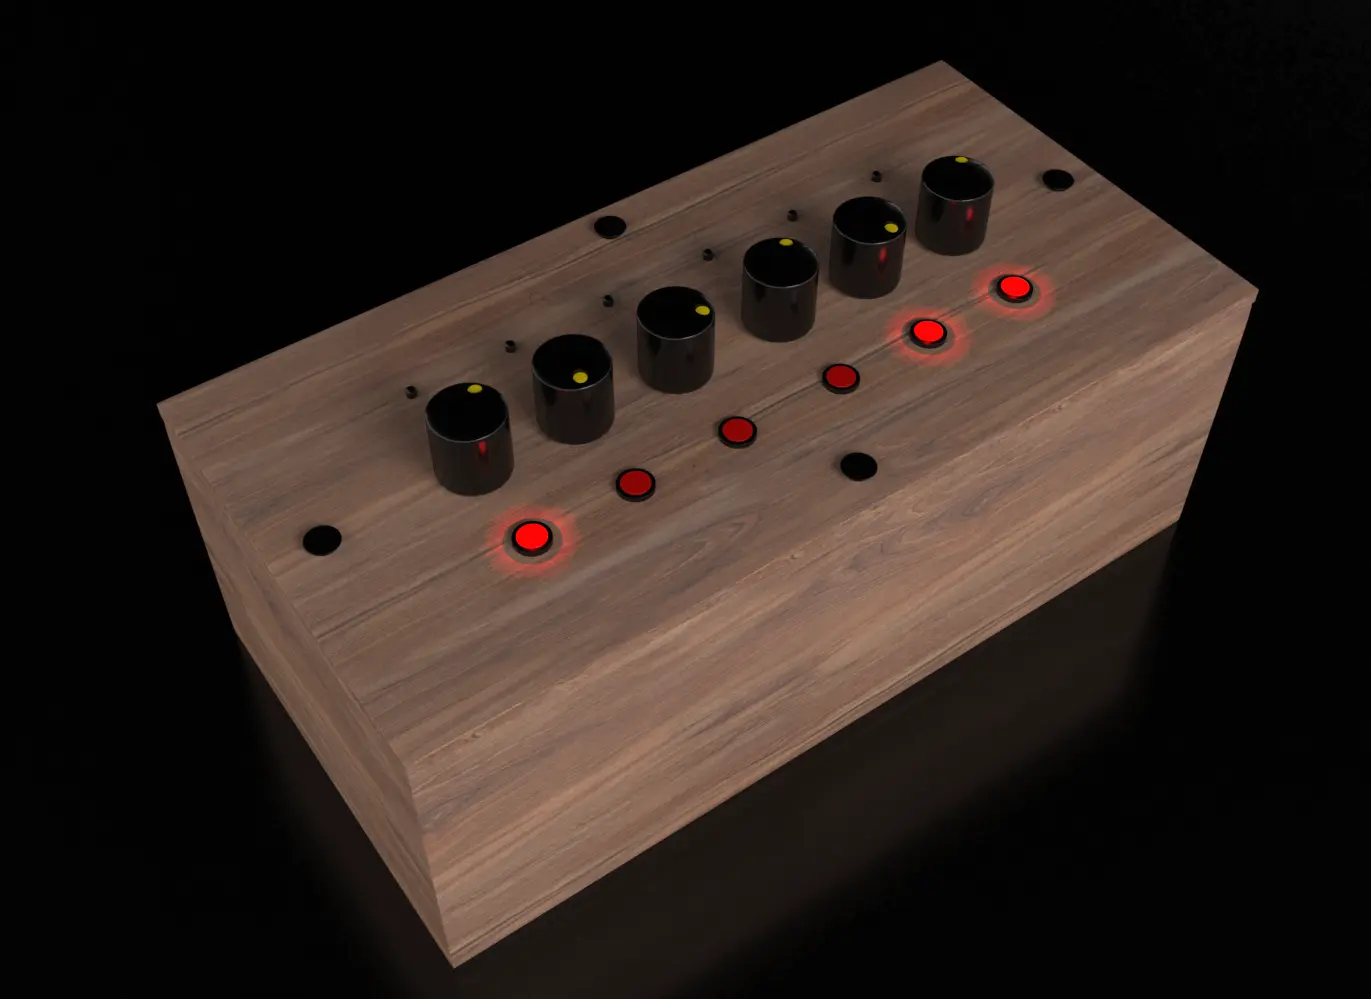
Creating an assistant in the typing loop
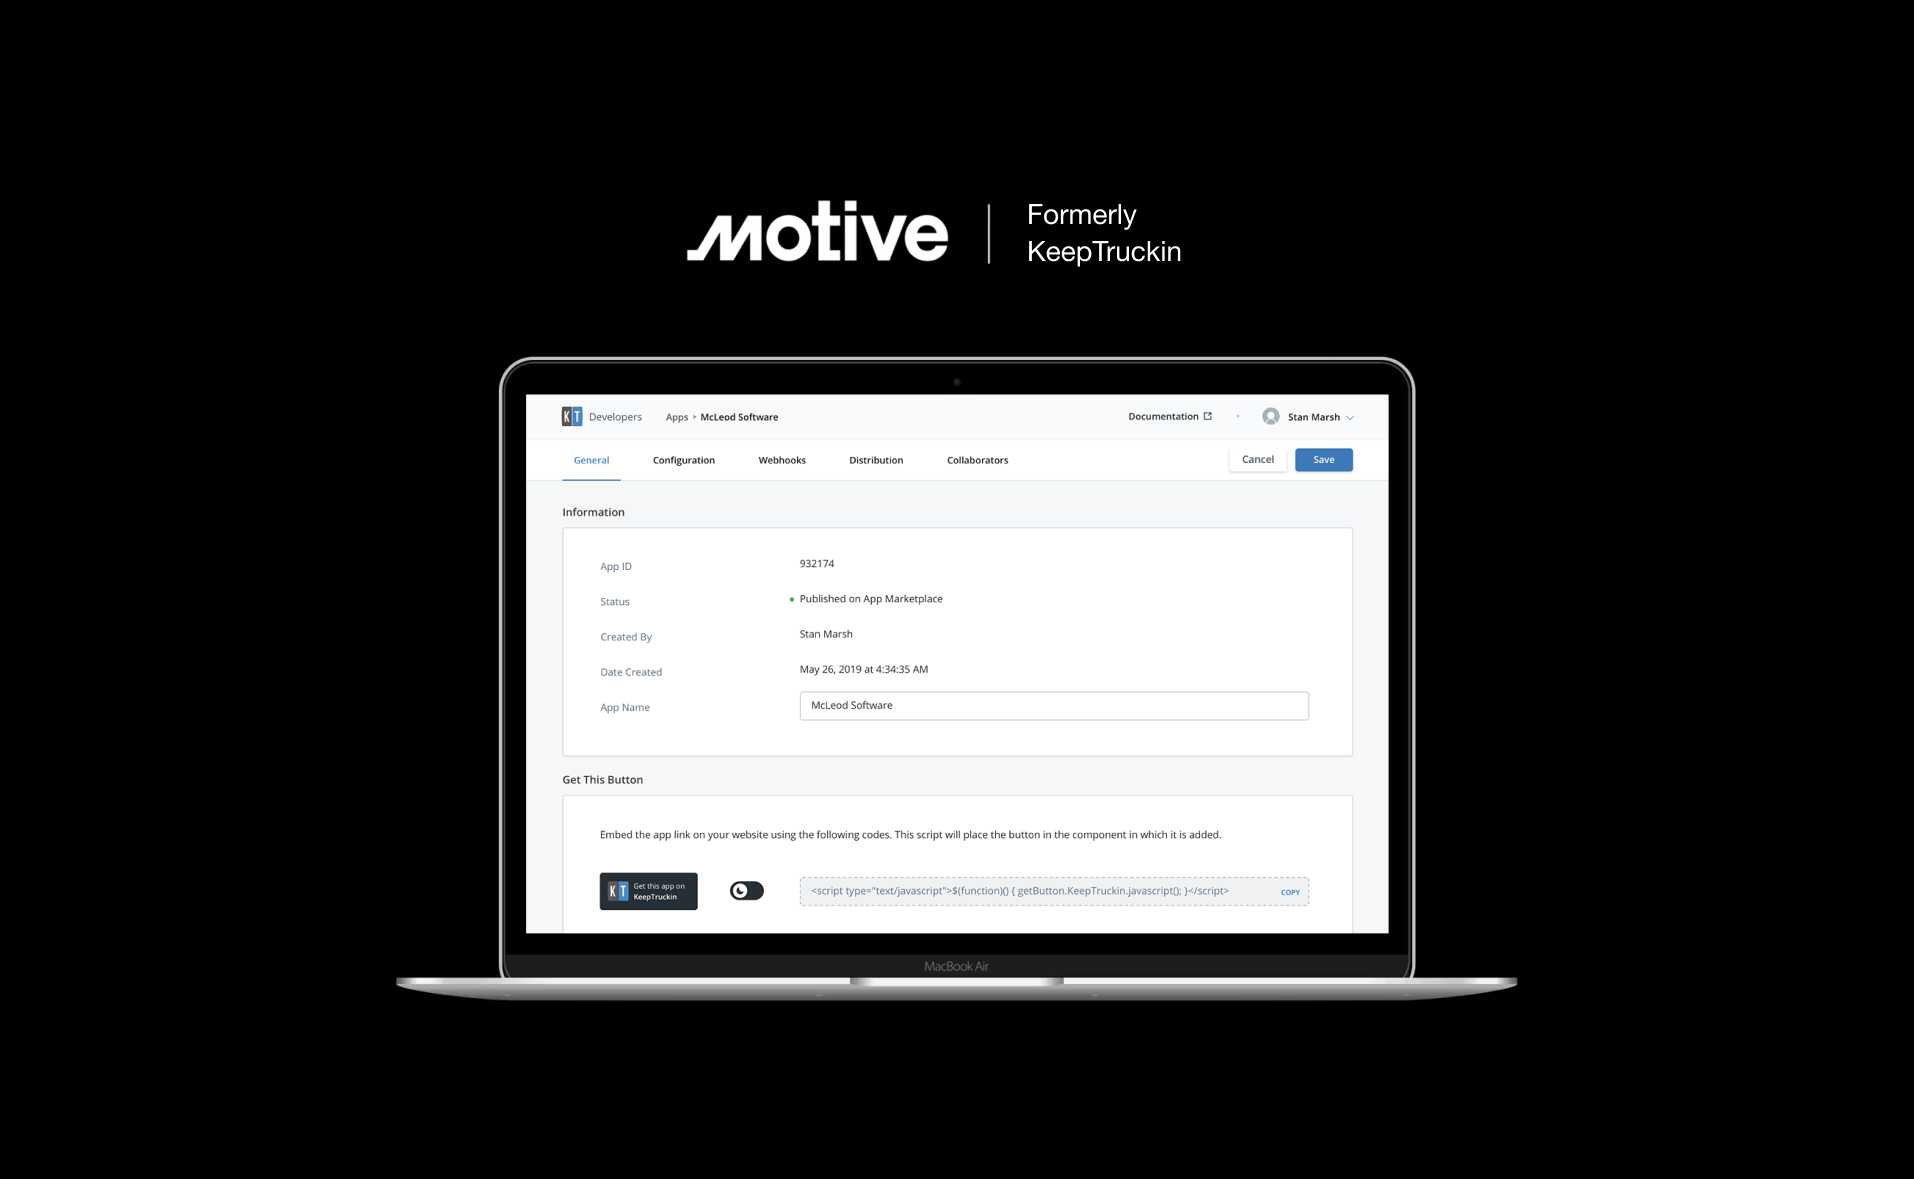
As a designer on the Context IQ (CIQ) team, I created an interface that delivers relevant information, content, and tools directly within users' workflows, reducing the need to switch between apps. Integrated seamlessly into apps like Word and Outlook, CIQ streamlines tasks, maintains focus, and enhances productivity. It also serves as a grounding affordance in Copilot, helping users select and reference the right content in their prompts to generate more accurate and effective outputs.
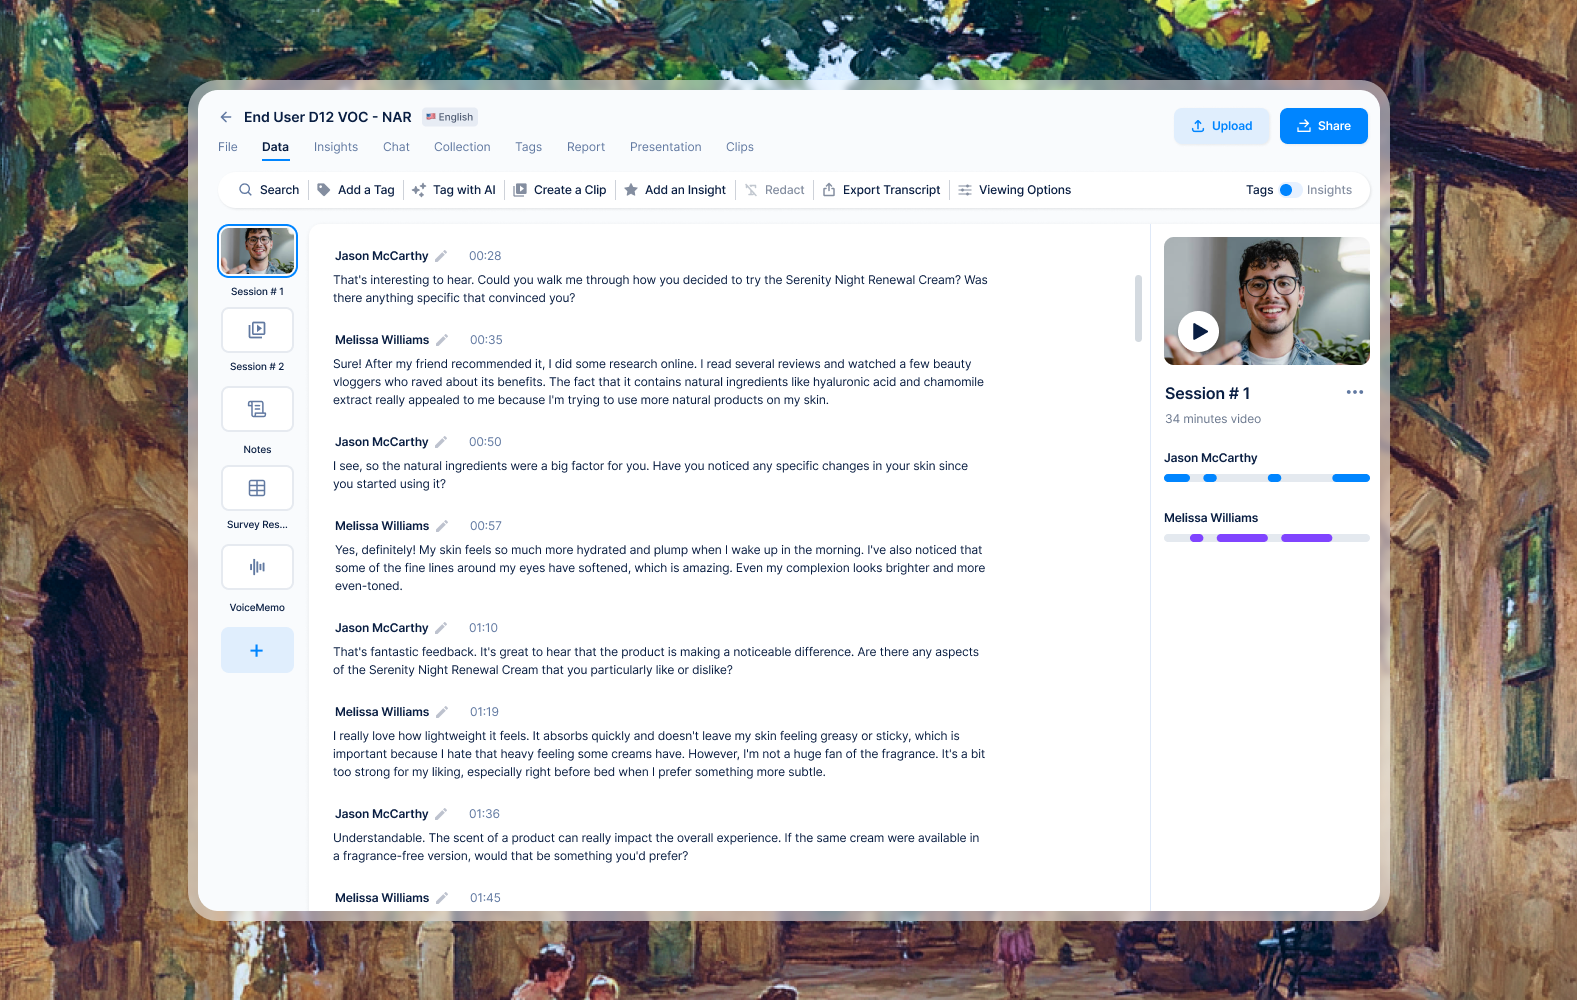
Crafting User Evaluation's AI Platform
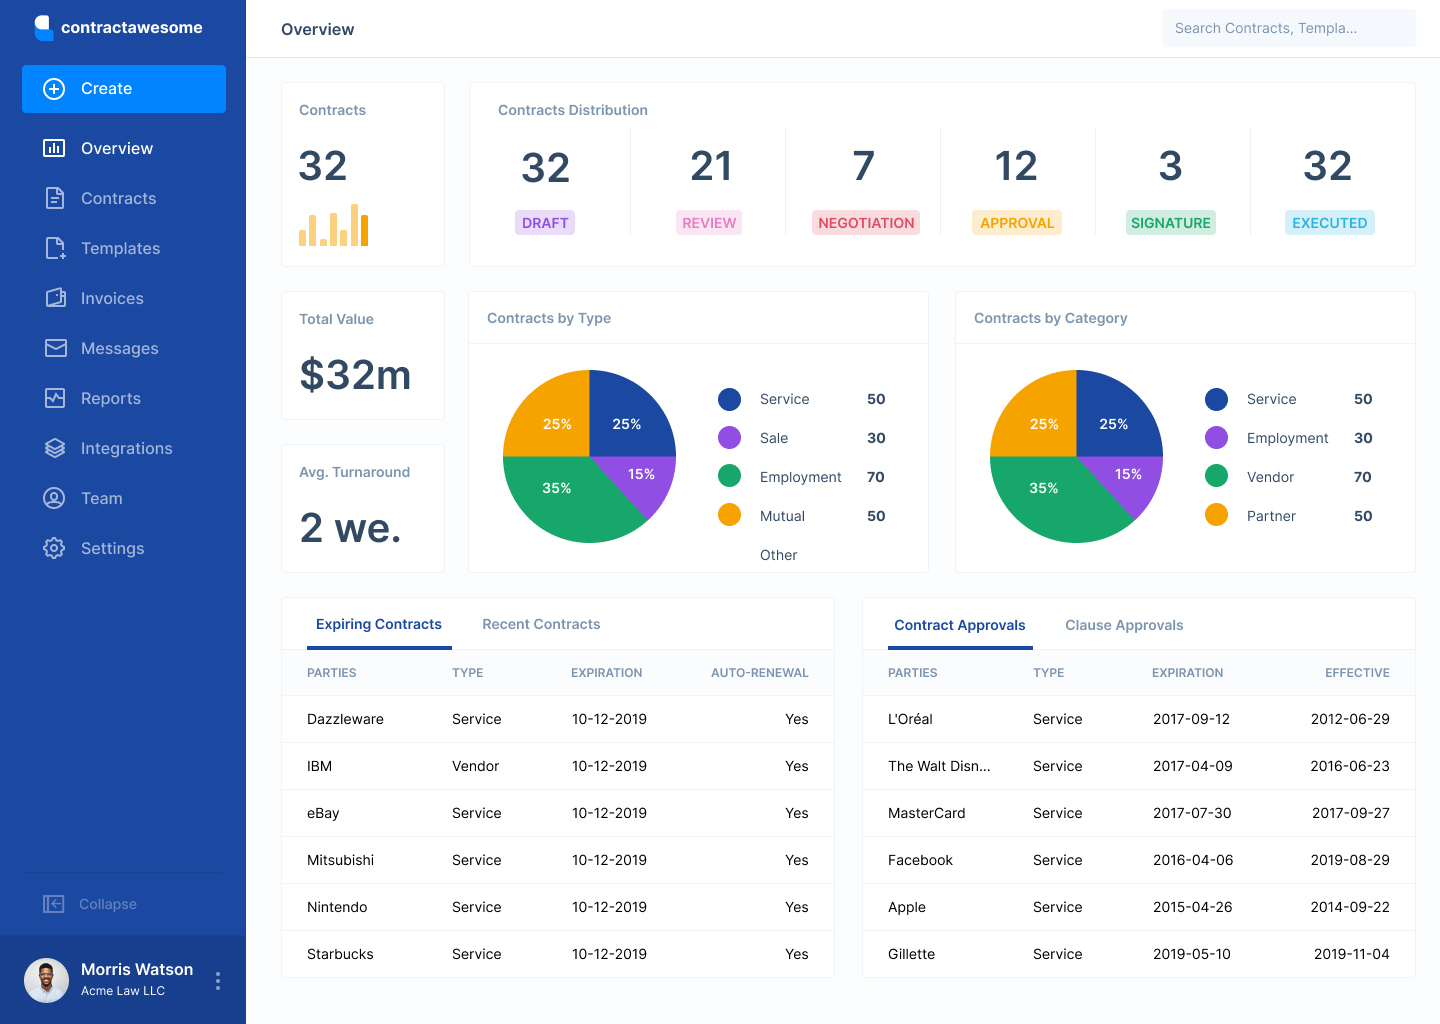
At User Evaluation, I steered the design process from early concepts to a full-fledged AI-native platform, tackling customer understanding at scale. Beyond UX, I also played a product management role, shaping the vision and requirements for features like robust transcription, AI insights, and multimodal AI chat. By aligning every feature—from AI-generated reports to advanced visualization—with business objectives, I helped position User Evaluation as a leading solution for AI-driven customer research.